

The problem: unseen drift erodes output
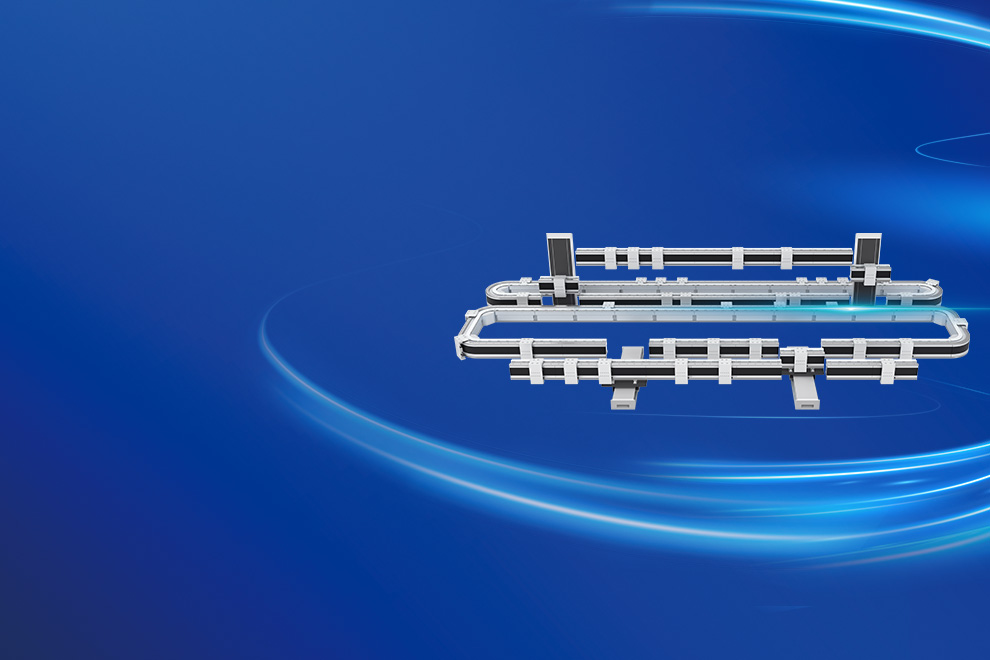
Production teams often notice performance slips long after they start — small deviations add up to scrap, rework and missed delivery windows. That’s the practical problem here: missing the right signals. I’ve followed industrial automation reporting for years and spoken with production engineers who point to gaps where sensors and software don’t connect cleanly to decisions. A reliable intelligent conveyor system and a well-tuned flexible transport system can surface those signals early. One clear real-world anchor is the inspection practices used at major automotive plants in Stuttgart, where traceability and material flow are a constant focus.
Primary metrics to capture on the line
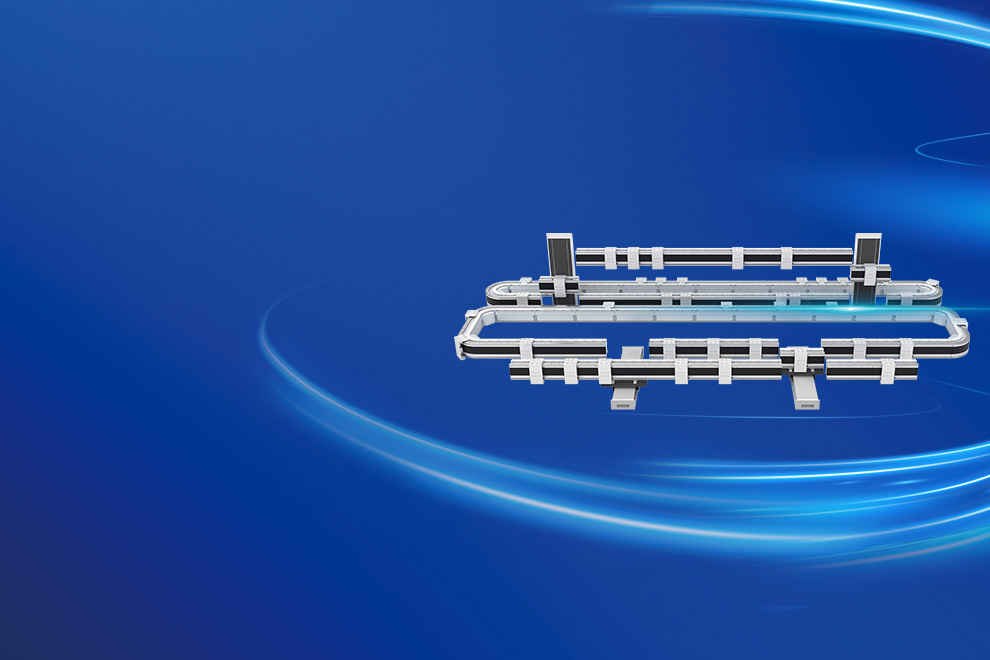
Track a short, practical list that answers “what changed, where, and why.” Focus on these datapoints:- Throughput per operator station (units/hour) with timestamps.- Part-level trace ID and process step completion times.- Temperature and humidity at cell and pack assembly points.- Torque and press force logs for fixtures and fasteners.- Vision-inspection results with confidence scores and rejection causes.- Conveyor speed, accumulation events and lane-switch incidents from your transport hardware.- Operator interventions, downtime reason codes and repair time.Record raw values and simple derived metrics (rolling averages, variance) so you can test hypotheses rather than guess.
How to monitor: method, cadence and tooling
Decide what needs immediate alarms and what can be trended. Use fast sampling for control variables, slower for quality trends.- Control loop variables (torque, force): sample at 50–200 Hz where possible; raise immediate alerts on setpoint drift.- Vision and electrical tests: capture each result tied to trace ID; flag patterns of low-confidence images.- Environmental and conveyor telemetry: 1–5 second updates for status; minute-level aggregates for trends.Combine edge aggregation with lightweight cloud storage. Local PLC/edge compute handles high-frequency control; a time-series store supports historical analysis and SPC charts. Pair threshold alerts with simple anomaly scores so operators can act without chasing noise.
Where to embed monitoring hardware and software
Place sensors where variation first appears: at feeders, torque drivers, press interfaces, and pack staging points. Don’t bury quality checks only at final inspection. Make these arrangements:- Inline capture at feeder pick points and after key joins.- Vision stations at joints and label/ID application zones.- Conveyor occupancy and jam sensors at choke points.- A lightweight MES record to lock traceability across handoffs.Software: keep dashboards task-specific. Operators need clear pass/fail signals and quick remediation steps. Engineers need aggregated views, control charts and the ability to drill from a failed unit to its entire process history.
Common pitfalls and how to avoid them
Teams repeatedly stumble on a few things:- Collecting everything without a purpose. Solution: start with the metrics above and add only when a concrete question arises.- Ignoring time alignment. Sync timestamps across devices to milliseconds if you want meaningful root cause.- Over-alerting. Tune thresholds and use aggregated anomaly scoring to reduce false alarms.- Treating conveyors as passive. Conveyor behaviour often causes variation; treat it as part of the process, not infrastructure.- Skipping operator workflows. Monitoring that disrupts work will be bypassed; integrate alerts into existing operator displays and procedures.

Validations and quick experiments
Before rolling changes across the whole line, run short A/B experiments on a cell:- Blind test a tweak for one shift and compare reject rates and cycle times.- Correlate a conveyor speed change with vision rejection to see causality.- Inject synthetic anomalies into historical data to test detection rules.Keep experiments short and measurable: a clear baseline, a single variable change, and a defined decision rule at the end.
Final synthesis
Start by fixing the smallest, fastest-to-measure failures: part trace, station throughput and a couple of quality checks. Use coordinated sensor placement, aligned timestamps and practical dashboards so teams can respond. That approach turns data from a post-mortem into a daily tool for stable output, and it’s precisely the kind of capability that industry practitioners and system designers look for when evaluating solutions from suppliers such as FHS.